
All you need to know about using TLC data for flash method optimization
It is common practice for chemists to run a thin layer chromatography (TLC) screen prior to attempting full-blown flash chromatography. Besides saving time, solvent and sample, users can use their TLC data to find more suitable parameters for future flash chromatography runs. This post highlights the theory of how TLC results can be converted into optimized separations and offers a glimpse into how certain software can convert TLC data into better purifications.
This weekend, I had the pleasure to observe our neighbour’s daughter learning how to ride a bicycle. She managed just after a few tries and was proudly grinning from ear to ear afterwards. I was not surprised that she accomplished this feat so easily, as she spent nearly all last summer on her balance bike. She managed to transfer her balancing skills from the simpler no-pedal bike to the intricate grown-up bicycle quite swiftly.
Funny how we scientists in the lab function similarly. We often start with simpler experiments and methods that require less resources before we transfer our knowledge and attempt more sophisticated techniques. Take thin layer chromatography (TLC) and flash chromatography for example. Due to simplicity, speed and minimal sample usage many flash users prefer to run a TLC screening of their sample prior to purification.
Just like going from a balance to a pedal bicycle, one can use the information gained from the TLC experiment to perform more challenging flash chromatography.
How can TLC results be transferred into a useful method on an automated flash instrument?
Firstly, we need to understand the relationship between data obtained from the TLC screening and the column volumes (CV) needed for the separation on flash cartridges. An example of a typical TLC screen is shown below.
Fig. Example of a TLC screen where (a) represents the distance travelled by the solvent front and (b) the distance travelled by the analyte.
After running a TLC screening, it is necessary to calculate the retention factors (Rf) of the various spots. This can be done with a simple equation:

where Rf = 1 means no retention on TLC (moving up with solvent front) and Rf = 0 means no affinity for solvent (staying at starting line).
The methods developed using TLC are transferable to flash chromatography, because of the following relationship between retention factor and column volume:
The inverse relationship between retention factor and column volume can be visualized in practice as follows:

The optimal Rf value range is 0,15 – 0,35 which results in CV range 2,8 – 6,7.
Smaller Rf values result in very long run times and high solvent consumption, whereas larger Rf values result in short run times with risk of incomplete separation as demonstrated in the graph below.

Fig. Examples of TLC screens and flash chromatographs at different Rf and CV values. (a). Smaller CV values result in shorter run times that could lead to incomplete separation. (b) A CV range between 2,8 and 6,7 results in the best balance between resolution and run times together with solvent consumption. (c) Larger CV values result in long run times and high solvent consumption.
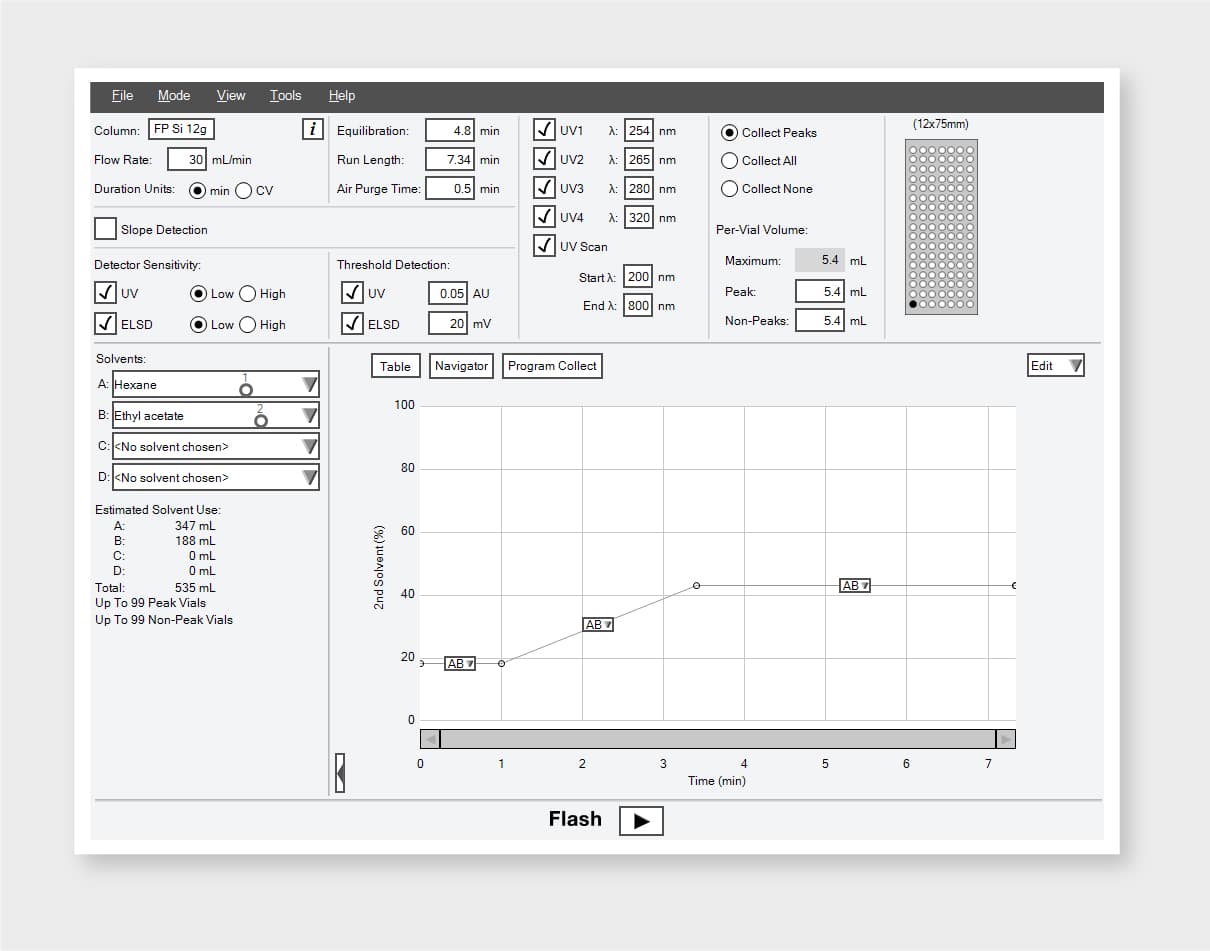
These theoretical considerations can be readily applied in specific method development software, such as Navigator. This program can convert TLC data into an optimized flash method to obtain the best separation and purification possible.
Users need just a few simple steps to transfer their TLC results into the software and determine the most suitable parameters for their flash chromatography process.
Step 1: Enter TLC retention factor data and flash cartridge info into the software.

Input solvents used and Rf values. Then select cartridge type and corresponding flow rate.
Step 2: Software auto-calculates flash conditions.
After clicking on the “Calculate” button and accepting the results, the system is ready to start running with the proposed solvent conditions.
Step 3: Obtain optimal chromatographic separation.

At the end of the run, optimal separation and collection of the compounds is obtained.
A note of importance is that using different silica on the TLC plate versus the flash cartridge might generate differences in results due to different selectivity of the silica.
Ideally plates and cartridges should contain the same type of silica.
With these considerations and software applications in mind, easy transfer of your TLC data will help you to obtain the best purity possible for your target compounds.
To wrap things up by going back to the bicycle, a good balancing act is important for more than just riding a bike. A golden balance in flash chromatography is also something to strive for and I give my opinion on how to achieve it in the blog post “The “Golden mean” in flash chromatography”.
Are there any outstanding topics regarding chromatography, lyophilization or evaporation you’d like me to address on the blog? Drop any suggestions in the comments section below and keep coming back for more colourful tips from me and my colleagues.
Till next time,

WANT TO STAY IN TOUCH?
Click on the button and receive the latest posts directly in your messenger!
Related Posts
How to do sample introduction in Flash Chromatography?
When introducing a sample in flash chromatography, are you going for Wet or Liquid Loading? Learn about the two sample introduction techniques and how they influence the sample loss during the purification process →

The “Golden Mean” in Flash Chromatography
Which system describes perfectly the balance ratio between productivity and cost in flash chromatography? Open columns, automated or semi-automated systems?

How to overcome limitations in flash chromatography with an ELSD
Find out how ELSD functions and what benefits this detector can bring to your chromatographic experiments compared to UV detectors alone →
What might happen if you don’t equilibrate your flash cartridges.
"To equilibrate or not to equilibrate" flash Silica cartridges prior to loading the crude material and what possible risks you might face if you skip this step, read here →
Dear Buchi,
I am Andre Fahriz Perdana from Universität Hohenheim, Stuttgart, Germany. I am a Ph.D student doing separation of glycolipids by using Buchi’s Medium Pressure Liquid Chromatography including the Column.
I just want to know how to open the Navigator from Buchi’s Sepacore Control in the computer. Or do I need to buy the software? The Navigator is explained in this link https://www.barts-blog.net/how-to-transfer-tlc-results-into-a-flash-method/
Thank you